22 Dec 2011
Urban Mixing Installation
The six weightings for each thematic indicator could be changed as part of ongoing a debate, encouraging discussion about how importantly each theme is valued.
The Toolkit was also marketed as a product, with a CD, booklet and quick start guide.
A control pad was custom built to control the scores.
The installation marked the end of the project and the collaboration between the different members of the Fenton Five who now undertaking their own, individual projects.
Urban Mixing
This project began with questions about how cities perform and how this performance can be mapped to reveal underlying patterns of urban behaviour. The Fenton Five used a research-based, design driven process to create an innovative tool for stakeholder participation and engagement about these issues - The Urban Mixing Toolkit.
Any change within the built environment requires policy makers, planners, developers and citizens to make informed decisions to shape their community. However each of these stakeholders will have different views about the course of that development and as such a common understanding of the underlying systems that shape these processes is required.
The Urban Mixing Toolkit is a flexible decision-making tool designed to help stakeholders engage with one another in the processes that shape the built environment in which they live, facilitate discussions, and develop a shared set of understanding about the value judgements of each stakeholder.
An extensive range of indicators are utilised to determine the performance of any one location in an urban area. Each indicator can be described as fitting into a wider theme, with a total of six themes used to describe the contemporary built environment: health, safety, learning, wealth, green and community. A Performance Score provides a weighted summation of each of these themes. These scores can then be used by stakeholders to make comparisons between different locations, their performance and the level of targeted investment needed in a particular area.
Overview
Any change within the built environment requires policy makers, planners, developers and citizens to make informed decisions to shape their community. However each of these stakeholders will have different views about the course of that development and as such a common understanding of the underlying systems that shape these processes is required.
The Urban Mixing Toolkit is a flexible decision-making tool designed to help stakeholders engage with one another in the processes that shape the built environment in which they live, facilitate discussions, and develop a shared set of understanding about what each stakeholder values most.
Working on the basis that a vibrant built environment is one in which people will want to live, work and play in, it must possess a diverse range of facilities, programmes and infrastructures. As such the performance of the Urban Mix is called into question using the Urban Mixing Toolkit. Identifying this mix and presenting possibilities for tuning the importance of its constituent parts.
A Performance Score provides a weighted summation that measures the performance of any location in an urban area, incorporating contextual issues in the form of thematic indicators. These indicators assess the built environment in terms of an agreed set of criteria within the themes of health, safety, learning, wealth, green, and community. The Performance Scores can then be used by stakeholders to make comparisons between different locations, their performance, proximity to particular resources and the level of targeted investment needed in a particular area. This is done through the medium of Performance Maps, a graphic visualisation of the Performance Score that relates the data to stakeholder’s daily experience of the city.
Each score can be modified so that each weighting reflects the personal preferences of that stakeholder, based on their own value judgements. Mapping these scores makes legible the underlying patterns of urban behaviour and serves as a tool for building a common understanding of the built environment. Revealing the interconnectedness of these environments has the potential to highlight and determine the level of strategic development or infrastructural improvement required in an area to improve its performance. As such the Performance Maps generated are dynamic representations, providing an integrated framework that is possible to operate at multiple scales.
Undertaking such an analysis comprehensively for an entire urban region can help determine the level of investment required to improve that areas performance and, most importantly, inform that decision-making process and engagement with all stakeholders.
Thematic Indicators
The Urban Mixing Toolkit relies on an extensive range of indicators to determine the performance of any one location in an urban area. Each indicator can be described as fitting into a wider theme, with a total of six themes used to describe the contemporary built environment:
- HEALTH: A place where people live longer and have a better quality of life.
- SAFETY: A place where individuals and communities feel safe and that is increasingly free from crime.
- LEARNING: A place where people are continually learning and developing their skills.
- WEALTH: A place that provides good quality housing with good job prospects and good wage levels.
- GREEN: A place that provides a quality environment for future generations.
- COMMUNITY: A place with a strong sense of community that celebrates diversity and equal opportunities.
Generating Performance Scores
A Performance Score provides a weighted summation that measures the performance of a given data point in an urban area. The score is calculated in two stages; the first giving an individual weighted score for each of the six themes at a given data point. Each indicator is assigned a weighting between 0 and 10. A weighted summation of these indicators is divided by the total of all the weightings, and then multiplied by a factor of 10 to give an individual theme score out of 10. The second stage gives a weighted summation of these themes to provide a measure of the Urban Mix and its overall performance at a given data point. Each theme score is assigned a weighting between 0 and 10 (Wt). A weighted summation of these indicators is divided by the total of all the weightings, to give a combined score for performance of the Urban Mix out of 10.
There are two degrees of interactivity that allows stakeholders to control the weightings used in the two stages of the calculation. In the first stage users can control the weights assigned to individual indicators and in the second the weights assigned to the themes. This has the affect of generating a weighted Performance Score that is unique to each stakeholder based on their own preferences. In the most basic scenario the indicator weightings can be kept constant for all stakeholders, reducing the number of variables by only changing the theme weightings and making comparisons easier. When indicator weightings are also changed the differences between stakeholders may become larger, making comparisons more difficult.
These scores can then be used by stakeholders to make comparisons between different locations, their performance and the level of targeted investment needed in a particular area. The lower the Performance Score the worse performing that data point is, in the opinion of that particular stakeholder, and as such it will require targeted investment to raise the performance of that area. It is through discussion that stakeholders can discuss the weightings and importance of each theme to them and begin to understand the reasons behind the value judgements that define those weightings.
The same process is used to calculate scores for each data point, from which Performance Maps can be drawn, to enable decisions to be made about wider built environment.
Utilising Performance Scores
Performance Scores can be used to draw comparisons between different locations using the six thematic indicators. However the scores alone are limiting when simply compared in a tabular format. A visualisation of the scores is required in the form of Performance Maps. These maps provide an accessible format which can be understood by all stakeholders and it is these maps which serve as a tool for building a common understanding of the built environment. Different stakeholders can be empowered and align their actions towards a common, sustainable future that maximises the potential and the performance of the built environment.
Limitations & Potentialities
It is important to understand the limitations of any system, tool or framework when using it to make decisions about the built environment. First and foremost the Urban Mixing Toolkit is designed to aid the decision-making process and facilitate discussion amongst stakeholders; it does not provide a series of solutions.
Secondly, whilst the nature of the Urban Mix Score is closely linked to programmatic diversity there are no indicators assigned to a number of other variables such as house tenure or land prices which may have an impact on the built environment. There are also a range of other dynamic fields relating to social, cultural, political and economic landscapes that the Performance Scores do not take account of. However, there is the potential to read the Performance Maps in conjunction with other maps or data sets—natural systems, zoning, planning policy, historical analysis, infrastructure, population diversity—to improve the clarity of information on display. As such the toolkit could be expanded so that:
Decision-Making Tool = Healthier City + Safer City + Learning City + Wealthier City + Greener City + Community + … +…
This expanded decision making tool could also be linked to other applications, such as web based tools, including Google Maps or Street View, or other data feeds to augment the Performance Maps with real time information.
Whilst the data is presented in a two dimensional field there is the potential to move the visualisation into a three-dimensional landscape so that the data begins to resemble topographical maps. Whereas the current system displays data points as a series of circles, with the radius corresponding to the Performance Score, when represented as a three dimensional landscape height from a base point would be the determining factor. When analysing a larger area of the built environment, particularly when using grid-based analysis to determine data points, this may provide a more accurate interpretation of the performance of that area.
The way in which data is collected can also be expanded to improve its accuracy. Instead of a simple yes/no survey recording whether or not a particular indicator is present, the frequency of that indicator can be recorded instead: for example, low, medium or high. These can in turn be tied to a weighting to generate a more accurate Performance Score.
The Urban Mixing Toolkit is designed to be Open Source in so much as that it can be modified relatively easily by Policy Makers, Planners, Developers or Citizens depending upon the scenario they are being applied it to. It is hoped that the flexibility it affords will enable stakeholders to adapt the tool to these new scenarios in so doing develop new unforeseen applications that further aid the engagement and decision-making process.
27 Oct 2011
Model Making
20 Oct 2011
Back to studio...

After visiting Fenton the five went on to collate all the data which had been collected that week and begin formatting the results in order to reach the next stage of our investigation, which will later on be presented in a form of installation…
Bad Ass!
After a long day of collecting data the Fenton Five grew increasingly hungry and were lucky enough to stumble across….‘Harvey’s Bad Ass Café’ where the five of us were able to experience some of Fenton’s finest - Oat Cakes!
We were also lucky enough to meet a man called Mike who owned the café, he explained to us a bit about the history of Fenton as well as the café, Mike led us down to the cellar where he told us that the café had been around for over 100 years and that since they moved in [4 months ago] there were various pots, mugs and plates which had been left there for years…..badass!
Fenton Fun!
Along the way we stumbled across various interesting symbols, statues, monuments, emblems and signs part of Fenton. Fenton’s own mottto: ‘Onwards and Upwards!’which perfectly encapsulates the spirit of the town represented in Fenton’s very own monument. The image on the left ‘The Fenton Crest’ is a shield which is divided up into four quarters, separated by a fretty cross.

The pottery industry is represented by the vase in the top left and the bottle kilns in the top right. The coal industry is represented by the pit head wheel in the bottom left. In the bottom right quarter a sheaf of corn in front of a plough.
Data Collection
Last week the Fenton Five were out and about collecting data - filling out our individual surveys, conducting site analysis, understanding what Fenton is all about and a bit of chatting to the locals!
17 Oct 2011
After a long day...

After a long day of hard work...The Fenton Five were ready to head back to Manchester...some more so than others!
12 Oct 2011
A few supplementary points added to survey of tick sheets
Physical, practical and psychological aspects must be thoroughly treated and then enhanced with valuable layers through work on city qualities (both visual and pragmatic), which can root people in the space-----means city space perform well.
Physical:
(1)Safe
Street light;
CCTV;
Separated road of different functions or shared road;
Pedestrian’s priority (continuity of the pavement);
Consideration for bicyclist;
Warning boards and signs;
Window light at night;
Gate and fence;
Transition from public to private (semiprivate space for interaction);Car-free areas (St linked to the main road of Victoria Rd);
(2)Green
Gasoline used (number of cars);
Climate: humidity/wind chill (low buildings and trees alongside can reduce the strength
of wind)/solar heat/average temperature;
Lighting;
Litter bins distribution;
Bus station (How large is area that a bus station need cover?);
Plantations;
Practical:
(3)Healthy
Sedentary and moving activities;
Exercise space;
Noise;
Sunlight;
Proportion of walking/bicycling/public transportation/private car;
Pollution;
Proportion of the road-----traffic lane, bicyclist, pedestrianism (room for walking);
(4)Wealthy
Infrastructure, for examples: bench, plants, bollard;
Varied materials for city’s visualization;
Proportion of necessary activities and optional (recreational) activities;
Psychological:
(5)Sense of Communities
Average size of household, number of residents per hectare;
Community bulletins and boards and signs;
Advertisements for the public community area or infrastructures;
Communication among people on the public space;
The frequency of varied facades in the length of the road;
Human scale or traffic scale;
Street furniture that provides ”talkscapes”;
Unhindered sightlines;
(6)Learning
Artistic display (installations and temporary works for children learning);
Schools;
Educational institutions, for examples: exhibition, art gallery, theatre;
11 Oct 2011
Monday Walking in Fenton
The following picture showed my route yesterday. Following the methodology from previous posts, I began at the Stoke-On-Trent Railway Station and walked through the south part of Leek Road and City Road, and reached the node which is one of the two ends of Victoria Road. Then walked along the whole Victoria Road and turned to the north part of Leek Road, back to where I started.
![]() |
| Route taken on initial visit to Fenton. |
The two ends of Victoria Road are two big nodes with the roundabout connected a series of main roads leading to other parts of Stoke-On-Trent.
Victoria Road can be divided into different parts, because each has their own features, which was reflect in my change of emotion walking down the road. (From south to north)
1. Continuity of the residential area
On the southeast side of Victoria Road is a big area of residential area with some learning schools, so the south corner of Victoria Road is an area when there is transition from a residential area to a main commercial road. Features: residential houses alongside (type); front courtyards between the sidewalk and house (transition); monitor or CCTV in case of theft (safe issue); “Fenton Park” bulletins among residential area (community sense); no trees at all.
2. Combination of Houses/Church/Commercial
Features: boring and unified façade; shuttered doors; narrow road with two traffic lanes; narrow pavement; rarely people stay; no trees at all.
3. Commercial area with a variety of shops
This area basically consists of plenty of shops (clothing, mechanism, food, and supermarket). The width of the road does not stay the same, some of the area needs a little bit for a bigger public space for people to stay (however, with worse infrastructure). Features: colourful advertising bulletin; varied façade; more open and transparent on the ground floor; some awnings outside for people stay; more people walking through the toad; varied width of the road; narrow pavement.
4. Residential houses again with Fenton Park
Some residential houses again appeared along the road, but without front gardens, because the width of the road is too narrow. However, there is Fenton Park alongside, which is big green space, not only connected to Victoria Road, but also connected to different residential communities in the east area of Victoria Rd, which consists of lots of residential houses. The park must be the center of Victoria Rd, however, the space in front of the gate of the park is limited, with only a bust station near the gate. Features: Fenton Park, the mark of “Fenton” (community sense); green and environmental; people stay in the space for a long time (optional activities and recreational activities).
5. Fewer buildings with more grassland and trees
It is an area which transitions from the intensive buildings to less density, which give it a bit more space for grass and planting trees, which definitely contrasts to previous parts of Victoria Road, with little plants. But alongside are fences and brick walls, which get in the way of the view or interaction between people as well as people and buildings. Fewer residents showed up or walked by. Features: more plants; less density; clear boundaries defined by brick walls and fence; fewer people.
6. Fenton Industrial Estate
This space consists of an industrial estate with broader roads and a bigger scale of building and road, which give spaces for the “outside activity space”, which, however, just turn out to be the parking space or the ground with no people at all. A lot of one-storey or two-storey big supermarket and factories alongside and so the view along the road is open, because there are fewer buildings. However the shuttered door and the big scale make people feel less warm, which makes residents just pass by quickly instead of staying. And also, few people walk on this part of Victoria Road. Features: big scale; broader road; big media advertisement bulletin and bigger slogans; few people walking; big burden of traffic; more private cars; strong wind.
7. Small scale of shops and residential houses back again
When getting closer to the node of Leek Road and Victoria Road in the north, the corner space is filled with small scale buildings along the road.
Other observations of Victoria Road:
Bus stops are limited with a long walk between each bus station; more private cars than public transportation (not green and not sustainable as there is less walking); no lanes for bicyclists (bicycle and car even share a road which is dangerous and there are fewer bicycles); little infrastructure (benches, bollards, monuments, plinths of flower bed) for people stay in a space except for the fenton park
Other parts of Fenton (Leek Road, City Road, King Street):
At the intersection of City Road and Leek Road, I found this bulletin which shows "Welcome to Fenton”.
It is interesting that the bicycle lanes sometimes share the road with car, and sometimes share the road with pedestrian, which is really dangerous.
There is more traffic than people walking and bicycling (not healthy), and there seems to be fewer optional or recreational activities outside (not lively).
Planning Policy for Fenton
![]() |
| Stoke Outer Urban Area Spatial Strategy |
The strategy sets out the following visions for the Outer Urban Area:
“The Strategy will provide for increased vitality and vibrancy of Longton, Tunstall, Fenton town and Meir centres and improve accessibility and availability of modern local facilities. Housing growth will be focused to address specific regeneration priorities at general densities of 50 dwellings per hectare, and the creation of new employment opportunities through major new development will maximise economic potential. Regeneration of the Outer Urban Areas will create sustainable communities, which complements the major growth planned for the City Centre and Inner Urban Core. Tunstall and Longton will continue to provide important district centre facilities serving the north and south of the City. Fenton and Meir remain as important centres in their own right. The character form and function of older residential areas will be improved and steps taken to improve and diversify the tenure of many social housing estates built in the suburbs of the City.”Within the strategy Fenton is defined as a Significant Urban Centre that "derives its town centre designation because of its historic role, rather than its retailing provision which is more characteristic of a local centre." Its current retail provisions is described as "limited" and there is "scope for an additional 500m2 of retail development, to serve a local catchment only." Furthermore Fenton is to serve as "a sport and leisure focus for the City", possibly because of the Fenton Manor Sports Complex and its close proximity to the Britannia Stadium.
![]() |
| Local Development Framework City of Stoke-on-Trent Proposals Map. Detail of Fenton and surrounding area. |
The 2011 Quick Guide produced by the Planning Department states that any area not covered by the City Centre and Etruia Road Corridor Area Action Plan or Inner Urban Core Action Plan will be covered by the Portfolio Development Plan Document. This document is currently under production is due to be published sometime in Ocotber 2011 and as such the most relevant information pertaining to Fenton has so far been found in the LDF document and proposals for the Outer Urban Area.
Earlier guidance, specifically the Revised City Plan 2001, designated two areas of wildlife interest in Fenton at the Manorfields Pool (Fenton Manor) and Smith's Pool, Fenton Manor was also highlighted as a site of particular known nature conservation interest. It also described two Local Centres (a third tier ofdesignation below Regional and District Centres) within Fenton: Kwik Save, 37-75 (odd nos) & 48-114 (even nos) Victoria Road; and 239-321 (odd nos) City Road, 5-15 (odd nos) & 2-26 (even nos) Christchurch Street, 7-17 (odd nos) Manor Street, & 2 Fountain Street.
Planning Policy for Stoke-on-Trent
![]() |
| Hierarchy of the Local Development Framework in the City of Stoke-on-Trent. |
The new Government has "clearly signalled their intention to rapidly abolish Regional Strategies" but as legislation regarding this abolition is still emerging these policies will still have a standing on development. As such the Stoke-on-Trent City Council will continue to use targets set out in the adopted (2009) Newcastle-under-Lyme and Stoke-on-Trent Core Spatial Strategy. This strategy "provides the foundation for detailed modern planning policy and supports delivery of North Staffordshire Regeneration Partnership and regeneration priorities in the City and North Staffordshire."
![]() |
| Newcastle-under-Lyme and Stoke-on-Trent Core Spatial Strategy |
The Council is currently working on three strategic documents (as of Spring 2011): The City Centre and Etruia Road Corridor Area action Plan; the Inner Urban Core Area Action Plan; and the Development Portfolio DPD (or the Outer Urban Area). These new plans will guide development over the next 10-20 years with the aim being that: "‘The Borough of Newcastle-under-Lyme and the City of Stoke-on-Trent will be a prosperous, vibrant, environmentally responsible and successful area of choice for businesses, visitors and residents in the period up to 2026."
![]() |
| Strategic Sub Areas (adopted 2009) |
The LDF states that "The polycentric nature of the conurbation means that the plan area contains a number of highly distinctive centres." It sets out a number of Strategic Centres (including the City Centre of Stoke-on-Trent defined by the "traditional core city centre bounded by the Potteries Way Ring Road"), Significant Urban Centres (including Fenton), Local Urban Centres, Rural Service Centres and Villages.
![]() |
| LDF City of Stoke-on-Trent Proposals Map (North and South combined) |
Furthermore the LDF adds that:
"The physical, social and economic landscape of the plan area is extremely diverse, and presents a multitude of different challenges and opportunities. To ensure that the Core Spatial Strategy addresses these challenges and opportunities efficiently and comprehensively, the plan area has been divided into six distinct strategic sub areas."Each centre is to have a clearly defined role within the wider spatial strategy.
![]() |
| Strategic and Spatial Strategies Diagram |
For a summary of Planning Policy in the City of Stoke-on-Trent see the following quick guide, produced by the Council in January 2011, here.
10 Oct 2011
Moving Forward
![]() |
| 1. Review of discussion with studio tutors. |
The first stage involved a discussion with our studio tutors, reviewing the pilot studies and what data was collected. This discussion continued amongst the group and a few key methodologies emerged, including the desire to develop a form of 'tick sheet' or survey that could be carried out along a route in Fenton. The intention would then be to 'graft' this data onto two-dimensional (in the form of plans and sections) and three-dimensional 'segments' of the route.
![]() |
| 2. Key themes each group member wanted to pursue. |
However, the exact nature of the study (what data would be collected) was less clear and as such the group went 'back to first principles' and identified the key topics that each member was interested in studying. Areas of similarity and cross over were quickly identified and a condensed set of key themes emerged: Perception, Infrastructure, Control, Regulation, and Scale.
![]() |
| 3. Key themes and looking for connections. |
The next stage involved identifying a loose research question or statement. The key themes were also further explored as was the idea of 'reduction' and how this could be applied to the themes and data collected. At this stage the notion of layering became prominent, with the intention to collect a wealth of data that could be layered to reveal new or previously hidden relationships.
![]() |
| 4. Developing relationships between key themes. |
In attempting to define a methodology to reveal the latent characteristics of a place (through the layering of different datasets) the idea of performance was also important, how does space perform?
![]() |
| 5. Exploring planning policy relevant to Stoke-on-Trent. |
The group then took a sideways step and began discussing current policy that is affecting the wider urban area of stoke-on-Trent, particularly planning policy. Research into Local Development Frameworks for Stoke revealed that Fenton lies at the boundary of two strategic areas of the city: the Inner Urban Core and the Outer Urban Area. It also revealed a proposal in which a future Stoke was defined as the following: a Healthier City; a Learning City; a Wealthier City; a Strong Sense of Community; a Safer City; and a Green City.
![]() |
| 6. Mapping the key themes and relevant policy areas. |
These six categories provide an interesting lens through which to study the Fenton area. If the intention is to improve Stoke in relation to these characteristics then it is possible to assess the current urban fabric in relation to these categories. Using the previously mentioned tools of tick sheets and surveys the intention is to document a route through Fenton in terms of these six categories. This data will then be grafted onto a three dimensional scaffolding that may reveal particular physical characteristics in the urban form that lend themselves to these categories. Concurrently a study of the 'perceived' Fenton will be carried out, using the same categories, which will enable the group to draw comparisons. There is also the potential to draw comparisons with idealised models.
24 Sept 2011
Fenton According to Wikipedia
| Fenton Skyline in August 2010 (Image: Wikipedia / EchetusXe) |
Fenton, meaning "flat, marshy land" is one of the six towns of the Stoke-on-Trent conurbation, situated in the south-east of the city. It has been dubbed the town Arnold Bennett, the English novelist, forgot in his 1902 work Anna of the Five Towns (he also wrote the Clayhanger triology and The Old Wives' Tale). It lies in a key geographical location, within easy reach of the A500, A34 and the A50, and is just a short distance away from Longton, Hanley and Newcastle-under-Lyme.
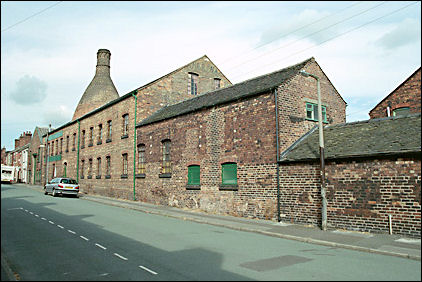
Many people semingly consider Fenton a sprawl of villages, including Heron Cross, Mount Pleasant, Saxonfields and Pool Dole, and although it has had its share of big industry, particularly from the Potteries trade, it is predominately a residential area. It first started to become populated when groups of farms and private small-holdings were built there, with the rapid develpment of the Potteries by the 1850s leading to growth around Duke Street and China Street. Fenton has been the home of a number of potteries such as Coalport, and its architectural heritage includes the Listed Christchurch, War Memorial, Bottle Kilm at the former Bencroft Works and the Calcining Kilns at James Kents. Large houses were established alongside pot-banks including Great Fenton Hall, Heron Cottage and Grove House. The two principal districts, Fenton Vivian and Fenton Culvert – each with their scattered communities, were brought together to make an urban district with its own board of guardians in 1894. On 1 April 1910, the town was federated into the county borough of Stoke-on-Trent. By 1925 the area was granted city status. It was bombined in the First World War by Zeppelin L21.
![]() |
| Heron Cross Pottery & Bottle Kiln (Image: © Brian Peach July 2001) |
Unlike over Potteries towns it doesn't have a centre, with amenities and shops spread over a sizeable area. a market, with approximately 25 stalls, is held every Thursday, based in City Road. Victoria Road contains DIY shops, home furnishings and electircal stores and a retail park, which inlcudes a Dunelm Mill and a Curry's. The town has a library (on Baker Street), based within the carnegie library, the only such building in Stoke-on-Trent. It also has a magistrates court, serving the whole city from within Fenton's old town hall. Fenton Manor Sports Complex apparently houses the biggest swimming pool in Staffordshire and 1,300-seat areana. Other recereational facilities can be found at Fenton Park, with football pitches, pavilions and a playground.